Content Velocity Tracking: 7 Competitor Metrics That Matter
Most teams track posts per month and miss the real signals. Learn the 7 content velocity metrics that predict competitor ranking moves 30 to 60 days early, the 4 patterns that telegraph a launch, and a 2-hour weekly workflow that scales from 5 to 12 competitors.
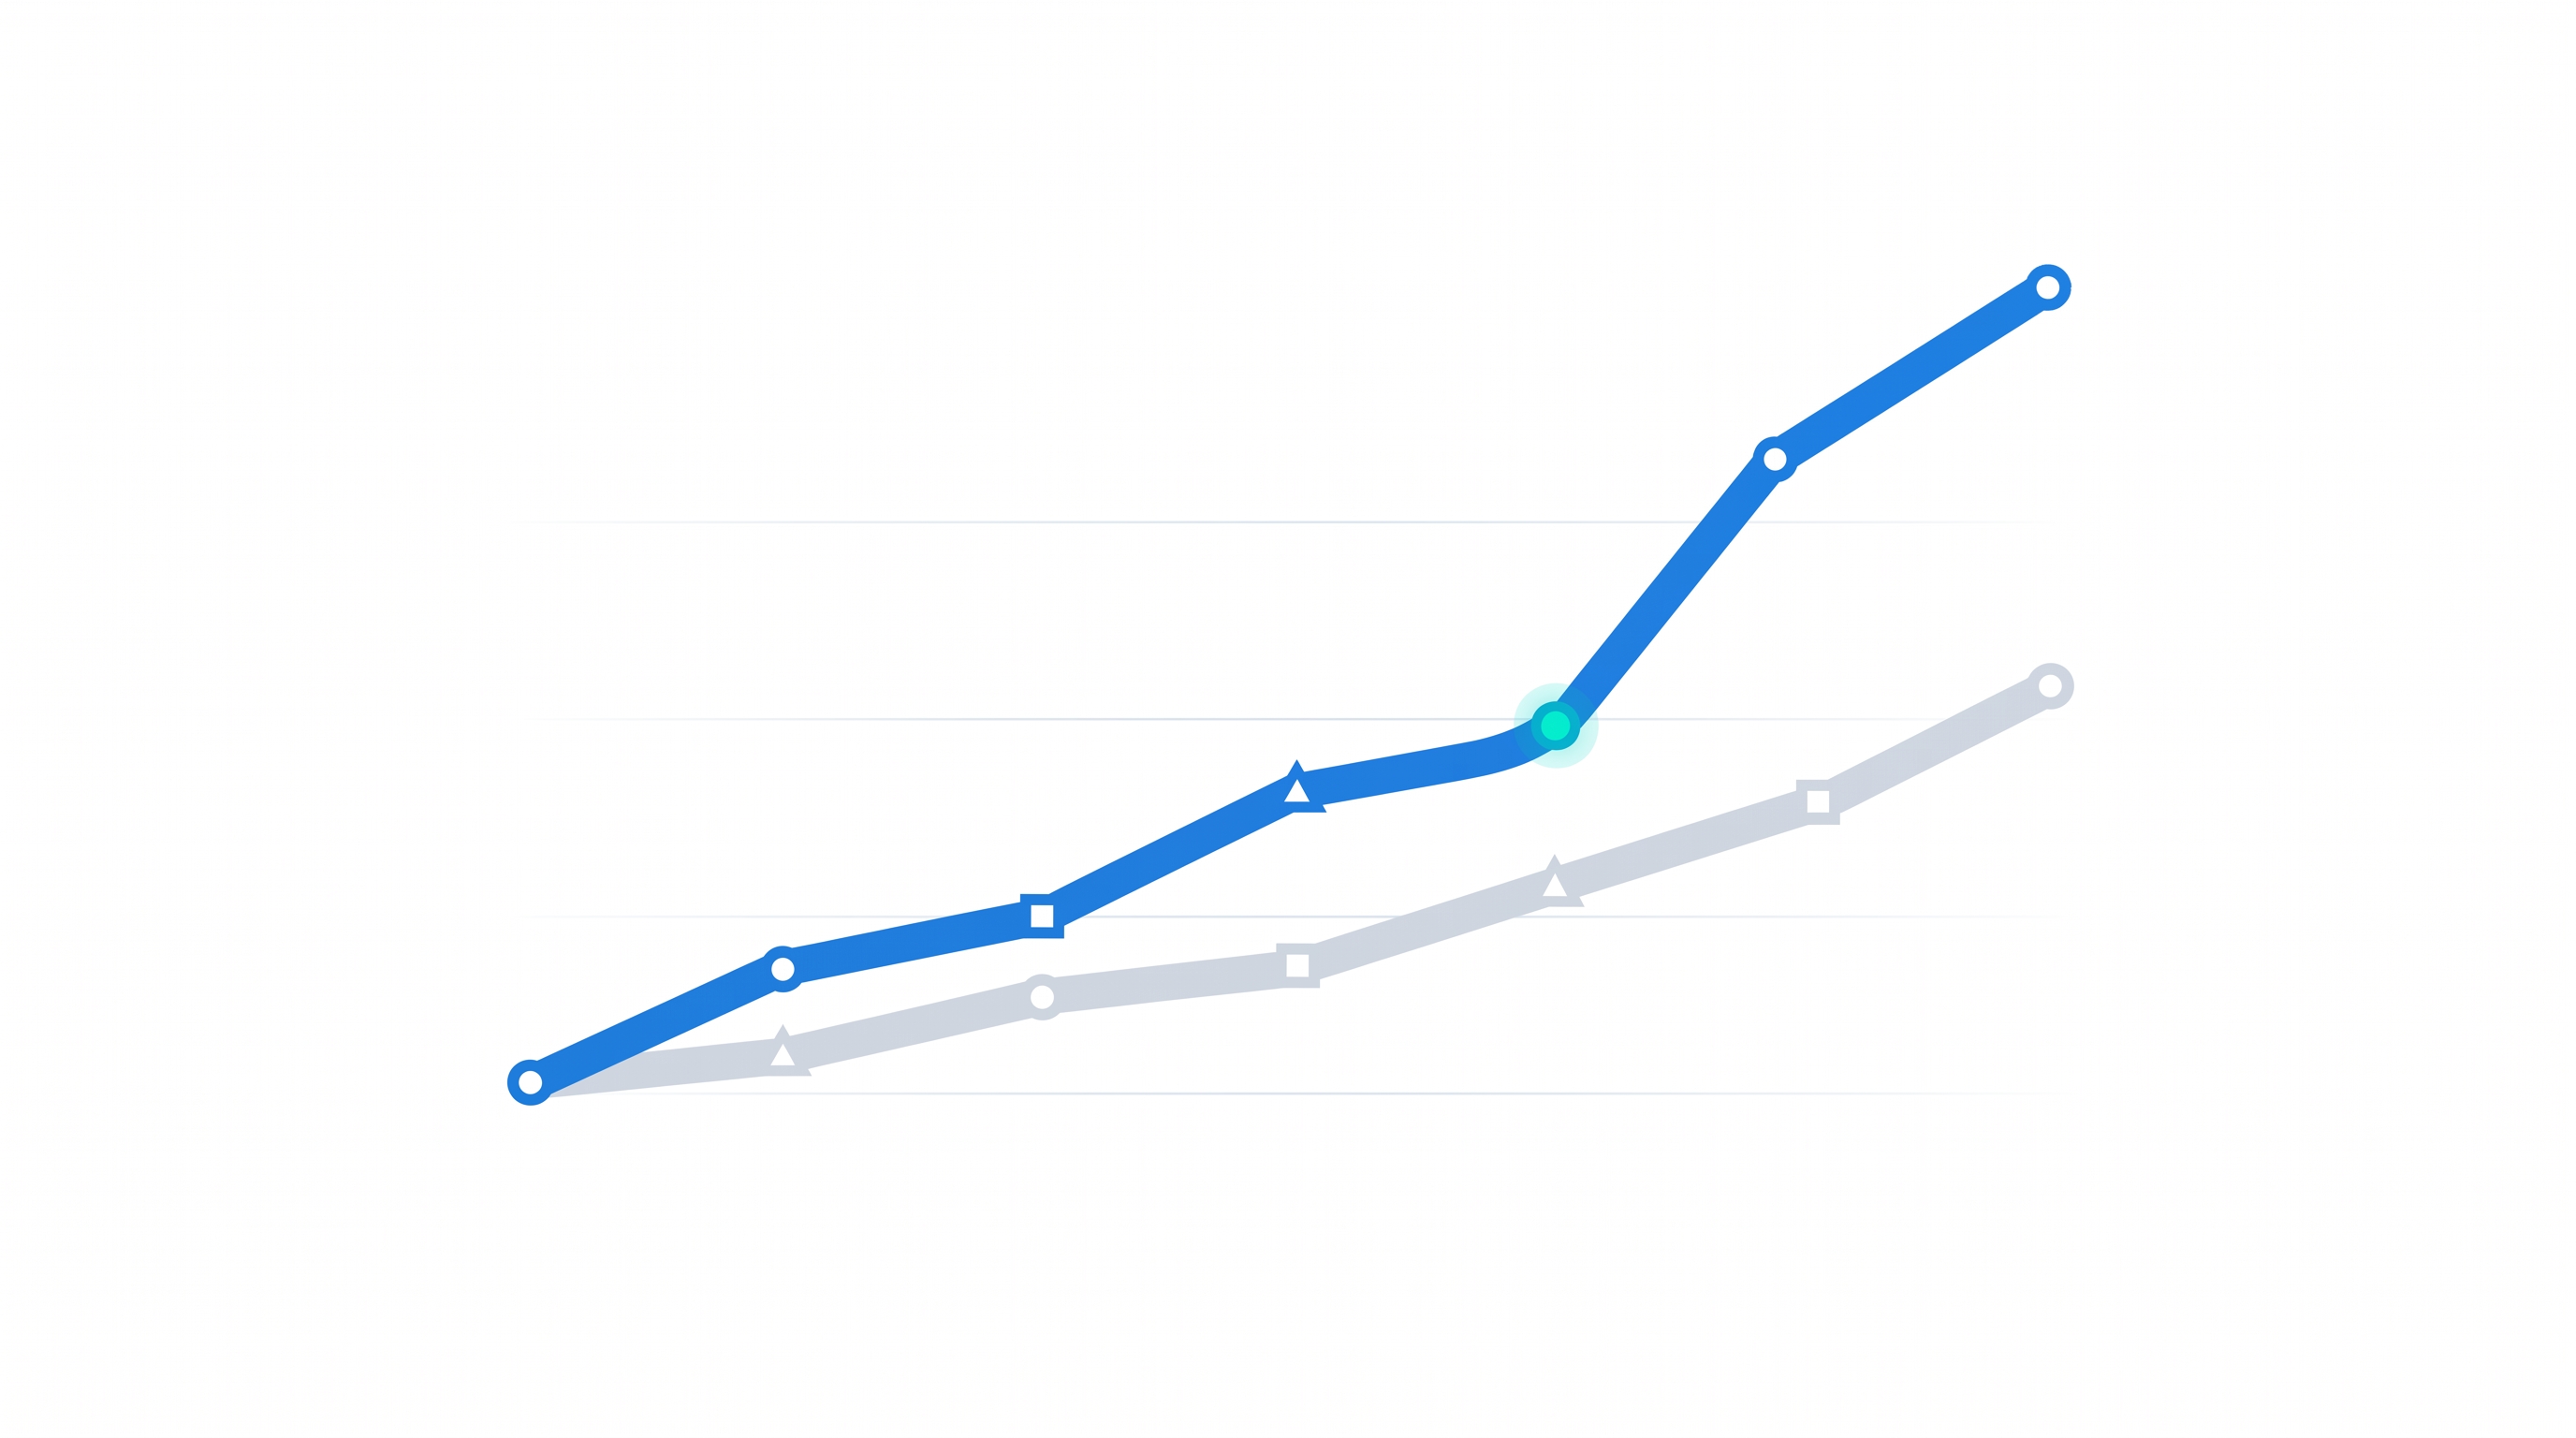
You notice a competitor's blog goes from publishing 3 posts a month to 12. Six weeks later, their organic traffic doubles. They take your ranking on three high-intent keywords. By the time your team reacts, they own the SERP and you are writing catch-up content that will not rank for another quarter.
This pattern is becoming the default, not the exception. Teams using AI-powered workflows are seeing a 3x to 4x increase in monthly content production without expanding headcount (Source: Averi AI). The startup that published 4 posts a month in 2024 is now competing with rivals shipping 12 to 16, often with better internal linking and faster updates.
Content velocity has become one of the earliest leading indicators that a competitor is about to outrank you, raise a round, or shift positioning. This guide covers the exact velocity metrics to track, how to read the signals, the workflows that make tracking sustainable for a small team, and the patterns that demand a response.
What Content Velocity Actually Means (and What It Does Not)
Content velocity is the rate at which a competitor produces, updates, and amplifies content over a defined window. The window matters. Weekly velocity catches launch sprints. Monthly velocity catches strategy shifts. Quarterly velocity catches budget reallocations.
Raw publishing volume is not velocity. Thirty posts in a month with no internal links, no updates, and no backlinks is noise. Eight posts that all earn referring domains is a signal. The difference is what gets confused most often, and it is also what separates teams that win on search from teams that burn writing budget.
There are three lenses worth watching:
- Production velocity: net new posts and pages per period, segmented by topic cluster
- Update velocity: percentage of existing library refreshed in the last 30 to 90 days
- Distribution velocity: link velocity, social velocity, and citation velocity
If you have not already, the velocity tracking work pairs well with a baseline view of your competitive position. Our complete guide to competitive intelligence for startups covers the broader system this slots into.
The Seven Velocity Metrics That Actually Matter
Most teams track vanity numbers. Posts per month. Total backlinks. Domain rating. These move slowly and tell you what already happened. The seven metrics below correlate with traffic and revenue movement before it shows up in your rankings dashboard.
1. Production rate by topic cluster
Posts per week or month, but segmented by cluster, not totals. A competitor adding 6 posts to a single cluster in 30 days is preparing something. Six posts spread across six clusters is editorial maintenance.
2. Update freshness score
The percentage of competitive content updated in the last 30 days. Below 80% indicates a stale library, which is both a vulnerability you can attack and a benchmark you should hold yourself to (Source: Arcade Software).
3. Link velocity
Net new referring domains per month. The investigation trigger is a spike of 50+ versus a baseline of 5 to 10 (Source: Reporter Outreach). That kind of jump is rarely organic. It usually means digital PR, a piece of original research that hit, or a partnership announcement.
4. Backlink-to-rank ratio
This is context for link velocity, not a metric you track in isolation. Pages ranking #1 on Google have 3.8x more backlinks than pages in positions 2 to 10 (Source: Reporter Outreach). When you see a competitor's link velocity rise on a specific URL, you are watching them build the asset that will displace yours in 30 to 60 days.
5. Topic cluster expansion
How many net new clusters or pillar topics appeared this quarter. New clusters often telegraph product expansion, ICP shifts, or upcoming launches. The first three posts in a brand new cluster are the cheapest signal you will get.
6. Content Gravity Model score
Validated across 2,500+ assets, the Content Gravity Model finds that assets scoring above 35 earn links at roughly 3x the rate of sub-25 assets (Source: Digital Applied). Original research has the strongest correlation with link velocity in the model. If a competitor publishes original data, expect their backlink profile to compound.
7. Distribution signals
View velocity, outlier ratio, and audience retention. Subscriber count is a vanity metric. View velocity tells you whether a piece is working in the first 7 to 14 days, which is when you can still react with your own coverage.
| Metric | Healthy range | Warning threshold |
|---|---|---|
| Production rate (per cluster) | 1 to 3 posts / month | 6+ posts in 30 days |
| Update freshness score | 80%+ in last 30 days | Below 60% |
| Link velocity | 5 to 15 new RDs / month | 50+ new RDs / month |
| Topic cluster expansion | 0 to 1 new clusters / quarter | 2+ new clusters / quarter |
| Content Gravity score | 35+ on hero assets | Sub-25 on hero assets |
| View velocity | Steady week-over-week | 5x baseline on a single asset |
| Outlier ratio | Predictable distribution | One asset doing 80% of traffic |
How to Read the Signals: Patterns That Predict a Competitor's Next Move
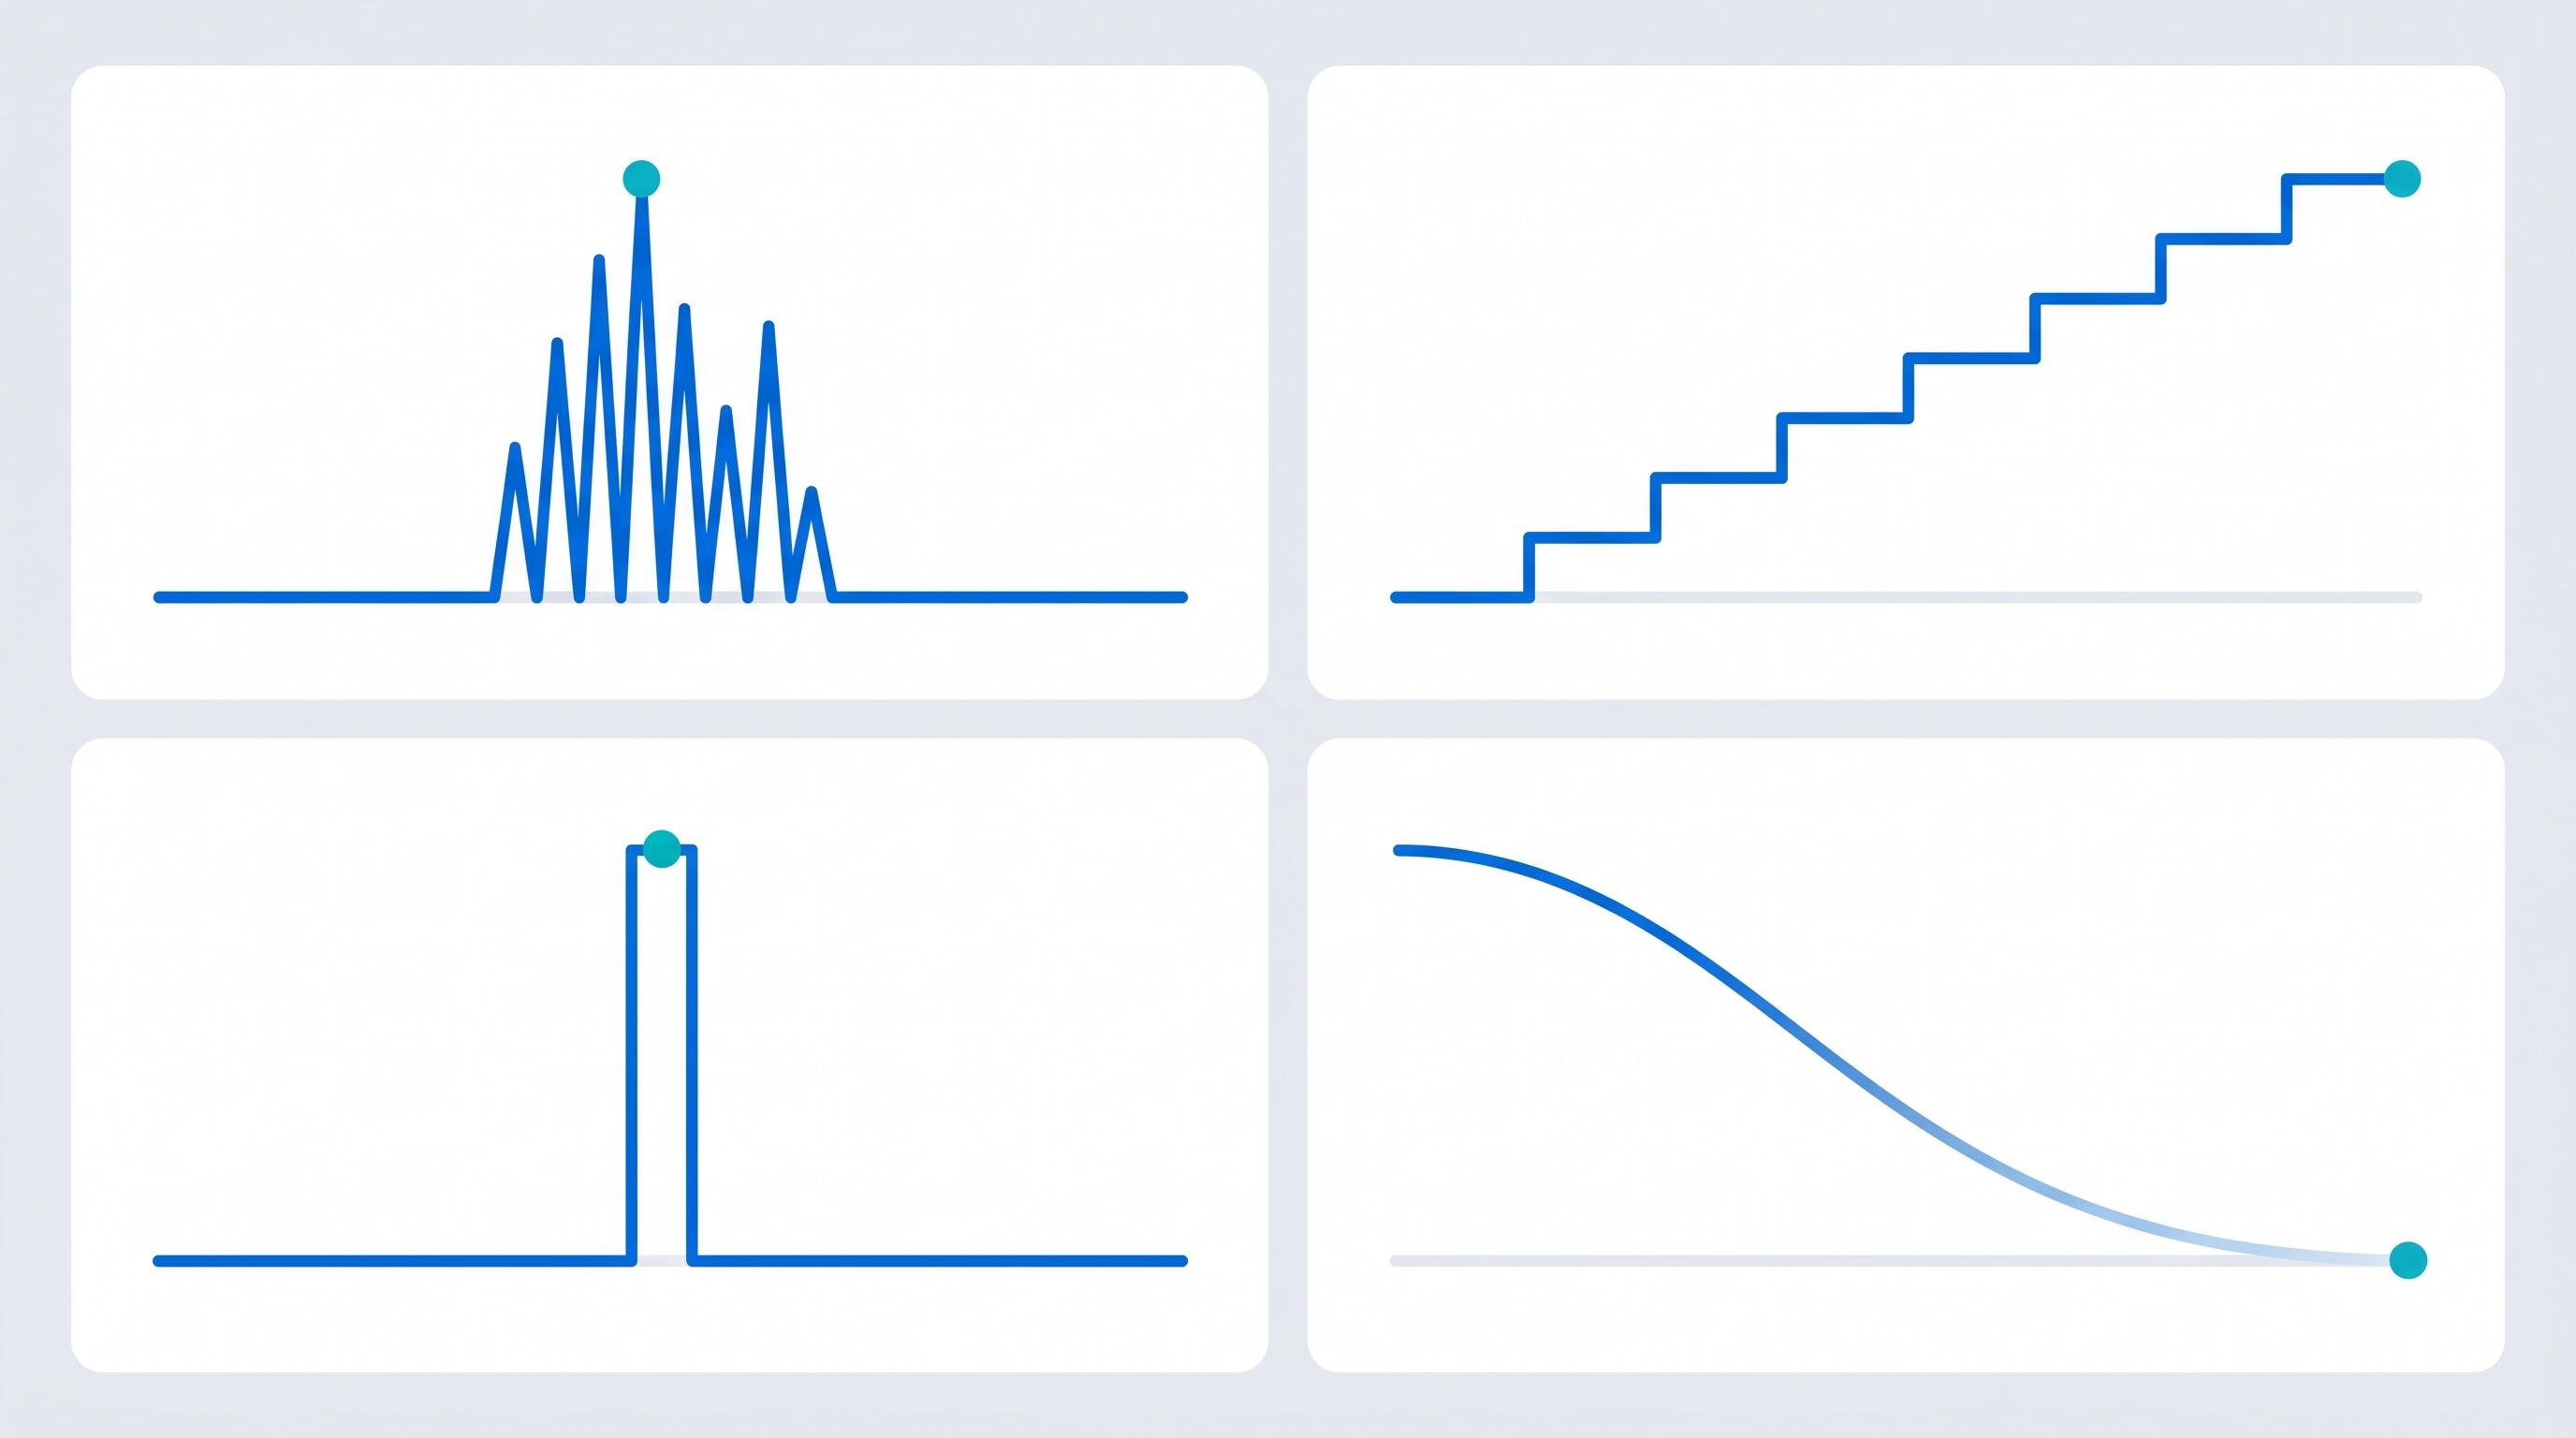
Numbers in isolation are not actionable. Patterns are. Four patterns repeat across competitive sets, and learning to spot them is the difference between reacting to surprises and pre-positioning around them.
Pattern 1: The cluster blitz
A competitor publishes 6+ posts in a single topic cluster within 30 days. This is almost always preparation for a product launch, a pillar page push, or a paid acquisition campaign that needs landing context. Your move is to identify the cluster and either accelerate your own coverage there or concede and double down elsewhere.
Pattern 2: The refresh sweep
40%+ of historical posts get updated in a quarter. This is defensive. The competitor is shoring up rankings before a content push or, more often, after a new VP of Marketing or an SEO audit. Refresh sweeps frequently precede a link velocity spike on the same URLs 60 days later.
Pattern 3: The link velocity spike
50+ new referring domains in a month against a 5 to 10 baseline almost never happens by accident. It is usually a digital PR campaign or a piece of original research that hit. One documented digital PR campaign delivered a 2,203% organic traffic increase in 6 months by analyzing competitor links and targeting the same publication tier (Source: Reporter Outreach). If you see this pattern on a competitor URL, study the referring domains. They are your link target list.
Pattern 4: The silent decline
Zero new posts and zero updates for 60+ days, with backlink decay. This often precedes a pivot, layoff, or acquisition. It is also a window. Customers of stagnating competitors are looking around. Your job is to be the first thing they find.
A Practical Tracking Workflow for Startups (Low Budget Edition)
You do not need an enterprise stack. You need a cadence, three tools, and a one-page brief. The workflow below scales to 5 to 8 competitors and runs in under 2 hours per week.
Weekly cadence (15 minutes)
Scan the blog index of each competitor. Log new URLs in a spreadsheet with date, title, and cluster. That is it. The point is to capture signal early, not analyze.
Bi-weekly cadence (30 minutes)
Pull the referring domain delta from Ahrefs free webmaster tools or any backlink tool you already use. Flag spikes. Cross-reference flagged URLs against your weekly post log. If a new post earned 20 referring domains in 14 days, that is your week's most important data point.
Monthly cadence (60 minutes)
Calculate the freshness score (count of posts updated in last 30 days divided by total posts). Identify cluster expansions. Write a one-page brief for the team with three sections: what changed, what it likely means, what you are doing about it.
| Cadence | Activity | Tools |
|---|---|---|
| Weekly | New URL detection, cluster tagging | Spreadsheet, Google Alerts |
| Bi-weekly | Referring domain delta, spike flagging | Ahrefs free webmaster tools |
| Monthly | Freshness score, cluster review, brief | Spreadsheet plus your benchmarking tool |
Where automation pays off
Manually scanning 10 competitors weekly is 2 to 3 hours per week. Most of that is checking whether anything changed at all, which is exactly the work software does well. SpyGlow's competitor monitoring detects new pages, content updates, and pricing changes automatically and classifies importance, which collapses the weekly scan to a 5 minute review of what actually changed. The change detection feature is what makes the update freshness signal trackable without manually re-reading every blog post.
If you are running this manually, the workflow above works fine. Automation is the tax you pay once tracking 5 competitors becomes tracking 12.
Turning Velocity Data Into Decisions
Tracking is worthless if it does not change what you ship next week. The mistake most teams make is treating velocity reports as a newsletter rather than a decision input.
A simple decision framework:
- High competitor velocity in a cluster you own: defend with a refresh sweep plus link building on your existing pillar
- High competitor velocity in a cluster you ignore: decide to enter or formally concede. Stop pretending you will get to it
- Low velocity from an incumbent: window to take share. Allocate budget here before they wake up
- Spike on a single asset: study the asset, study its referring domains, and decide if it is worth a counter
If you want to ask questions of the data instead of writing SQL on a spreadsheet, AskGlow can answer prompts like "which competitor accelerated publishing in our pricing cluster last quarter?" without you parsing rows manually.
The goal of velocity tracking is not a beautiful dashboard. It is a faster decision cycle on what to refresh, what to publish next, and what to ignore.
Want to skip the spreadsheet and see your competitors' content velocity, link velocity, and update patterns in one dashboard? Start a free SpyGlow trial and connect your first 3 competitors in under 10 minutes.
Common Mistakes That Waste Velocity Tracking Effort
Even teams with the right metrics get worse signal than they should because of preventable errors. The list below is the short version of what goes wrong most often.
- Tracking too many competitors. Pick 3 to 5 direct, 2 to 3 aspirational. More than that and the data becomes noise you cannot act on.
- Counting raw posts instead of weighted output. A 3,000 word original research piece is not the same as a 600 word listicle. Weight by depth and link potential.
- Ignoring update velocity. Net new is the easy metric, so most teams overweight it. Refresh activity is often the leading indicator.
- Not tying velocity to your roadmap. If your output of velocity tracking is not a refresh schedule, a new cluster bet, or a distribution sprint, you are reading reports for fun.
- Reacting to every spike. Some spikes are seasonal or one-time PR pops. Wait for a 30 day trend before allocating budget against a competitor move.
- Failing to segment by funnel stage. Top-of-funnel velocity tells you about brand bets. Bottom-of-funnel velocity tells you about revenue plays. Treat them separately.
How AI Changes the Velocity Game in 2026
The 3x to 4x production multiplier from AI workflows means baseline competitor velocity is rising across every category (Source: Averi AI). The team publishing 4 posts a month in 2024 is now competing with rivals at 12 to 16. The bar moved.
Matching volume is not the answer. The defensible play is matching cadence on quality signals: original research, refresh discipline, and distribution velocity. Original research in particular has the strongest correlation with link velocity in the Content Gravity Model (Source: Digital Applied). One well-cited data piece outperforms ten thin AI drafts on every metric that maps to revenue.
Velocity tracking now also needs an AI visibility layer. Which competitors are being cited in ChatGPT, Perplexity, and Gemini answers, and how often. Search-intent traffic is shifting from blue links to LLM citations, and the brands that get cited compound trust the same way early SEO winners did with backlinks. SpyGlow's AI visibility tracking complements traditional content velocity by showing where competitors win the LLM citation game, and SEO intelligence covers the search side.
Useful context on the broader content economy: the 2026 Sales Enablement Landscape Report tracks content adoption at 50% and quota attainment at 43.1% (Source: Arcade Software). Less than half of teams are even using the content their marketing departments produce. The teams winning are not the ones publishing more. They are the ones whose content actually moves through the pipeline.
Frequently Asked Questions
What is a healthy content velocity benchmark for a B2B SaaS startup?
There is no universal answer, but most Series A B2B SaaS teams shipping 4 to 8 posts per month with a 30 day freshness score above 80% correlate with healthy organic growth. Match the cadence of your top 3 competitors, then exceed on quality. If you are not sure where to start measuring, the competitor monitoring view shows publishing patterns side by side.
How do I track competitor content velocity for free?
Use a combination of Google Alerts for new content, Ahrefs free webmaster tools for backlink delta, and a manual spreadsheet logged weekly. Expect 2 to 3 hours per week for 5 competitors. Automation tools cut this to under 30 minutes. The tradeoff is your time versus the cost of missing a cluster blitz that takes you 6 weeks to spot manually.
Is content velocity the same as publishing frequency?
No. Publishing frequency is one input to velocity. True content velocity also includes update rate, link acquisition rate, and distribution rate. A competitor publishing less but earning more backlinks per post may have higher effective velocity than one publishing twice as often.
How often should I check competitor content velocity?
Weekly for new post detection, monthly for trend analysis. Daily checking creates noise and false alarms. Quarterly is too slow to react to cluster blitzes or PR spikes. The bi-weekly link velocity check is what catches the spikes early enough to matter.
What is link velocity and why does it matter for SEO?
Link velocity is the rate at which a page or domain earns net new referring domains over time. It matters because pages ranking #1 on Google have 3.8x more backlinks than positions 2 to 10 (Source: Reporter Outreach), and a sudden link velocity spike often predicts a competitor's ranking jump 30 to 60 days out. Tracking it bi-weekly gives you a window to respond before the ranking shift lands.
Should I match a competitor's content velocity if they are outpacing me?
Not blindly. Match cadence on quality signals (original research, refresh discipline, distribution) rather than raw post count. Volume without velocity on backlinks and updates rarely moves rankings. If you have spotted a true gap, content gap analysis is a better next step than copying their editorial calendar.
Ready to stop running this in a spreadsheet? See content velocity, link velocity, and update patterns for every competitor in one dashboard. Try SpyGlow free for 14 days.
Sources
- Averi AI, Scaling Content Production for Series A Startups: https://www.averi.ai/guides/scaling-content-production-series-a-startups
- Digital Applied, Content Gravity Model: Measuring Linkability: https://www.digitalapplied.com/blog/content-gravity-model-measuring-linkability
- Reporter Outreach, Competitor Links and Link Velocity: https://www.reporteroutreach.com/blog/competitor-links
- Arcade Software, Sales Enablement Content and 2026 Benchmarks: https://www.arcade.software/post/sales-enablement-content
- Plausible, Analytics for Bloggers and Creators: https://plausible.io/for-bloggers-creators
- Guideflow, Sales Enablement Metrics: https://www.guideflow.com/blog/sales-enablement-metrics
- GrowthSpree Official, B2B SaaS Sales Cycle Length Benchmarks 2026: https://www.growthspreeofficial.com/blogs/b2b-saas-sales-cycle-length-benchmarks-2026-by-acv-vertical
Content Gap Analysis: How to Publish What Will Rank
Most content teams don't have a content problem-they have a prioritization problem. Learn how content gap analysis finds competitor-winning topics and turns them into a plan you can execute.
Competitor MonitoringWhat Is Competitive Intelligence? A Complete Guide for Startups
Learn what competitive intelligence really is, why it matters for startups, and how to build a system that turns competitor data into winning decisions.
Competitor MonitoringBest Competitive Intelligence Tools for Startups in 2026 (and Why Agentic Platforms Win)
A founder's guide to the best competitive intelligence tools in 2026, the three categories that matter, and why agentic AI platforms like SpyGlow change the game.
Ship the response, not just the read.
Free forever for your first two rivals. No credit card. Five minute setup.